Blog

  • Google My Business Optimization – a complete guide

    Remember the last time you were looking for a local bakery because you forgot a friend’s birthday and had to purchase a cake at the last minute. 

    Maybe your car broke down, and you looked up a car mechanic nearby to fix the issue as soon as possible. I bet it hasn’t been long. 

    The number of people searching online for a product or a service has been increasing every single day.

    “Near me” Google searches have increased tremendously over recent years. 

    Google estimated a 900% increase in “Near me” or “Close by” searches in the last couple of years.

    Just as we prefer to search about a shop or a service provider nearby, before actually visiting it, almost everybody likes to check out a business on the internet before deciding to make a purchase.

     This provides a great opportunity for all business owners. 

    Using Google My Business, you can make sure that anyone searching nearby for a business like yours finds it. 

    You have to provide all the necessary information about your business to help potential customers.

    Almost a 78percent of cell phone searches about local businesses generate an offline purchase.

    If you are not already using Google My Business, this is the right time to begin.

    Still not convinced? Read the below-mentioned statistics, and I assure you; you’ll be persuaded in no time.

    Important statistics regarding Google My Business

    • Four out of every five internet users, Use search engines to get information about local businesses.-Think with google
    • 70percentof consumers who search for a local shop online will visit it.
    • 28percent of local searches generate a sale.
    • Cell phones have influenced almost 1.4 trillion USD in purchases.
    • 97 percent of people prefer using the internet to get information about a business.

    Let’s see how we can create and optimize our Google my business account.

    Creating Account

    Google my business account is a crucial part of SEO. The information listed should be accurate and up to date.

    Almost 80 percent of users reported mistrust in a business if the information on the internet is false.

     You may be missing out on a lot of potential customers if you don’t have an online presence. 

    We see lemonade stands on our sidewalks all the time. 

    Have you ever wondered why people open these stalls outside on the sidewalk rather than their lawns? Because if you are not visible to the people, they will be clueless about your existence.

    To be seen by people, you must exist where they do. It wouldn’t be wrong to say that nowadays, people exist online, so that is where your business should be visible.

    We will learn all about the creation of google my business account. 

    Make sure you follow all the steps, and I assure you this process will be smooth sailing.

    Profile creation

    After setting up a new google account or opening a previous one, log onto google.com/business.

    Entering Name

    Click on the Manage now button on the top right corner. Now enter the name of your business. If your name is identical to other local businesses, auto-complete will suggest them to you.

    There is a chance that someone might have already created a listing for your business. In this case, auto-complete helps in avoiding duplication of listing. It is also useful if you want to add a new location to an existing business profile.

    If your business name is not shown in auto-complete suggestion, click on the blue text shown in the image that states” Add your business to Google.”

    Please enter your business name carefully; you can add one or two top keywords relating to your business in the name itself. Make sure that the keywords you are using have a connection to your already existing business name. If you are not cautious, your profile can get flagged by your competitors or even customers. Keyword stuffing in the business name often results in the suspension of a listing.

    Choosing a category for business

    It is vital to choose a business category that perfectly describes your business. 

    Business category influences the kind of search results you appear in. It is displayed on your Google my business profile as well. 

    Some of you may already know the category your business fits in.

     If you are unsure, look it up on Google. You can also search profiles of your competitors to determine the category that is the right fit for your business.

    Entering Address

    Providing Potential customers the right address is very important for a brick and mortar business. The term Brick and mortar refers to businesses with a physical location where they entertain their customers.

    If you have a brick-and-mortar business, make sure you add the correct location of the business. Also, remember that you have to update any changes in your physical location on your google my business profile.

    In the case of a service area business, you can choose to hide your address. As you might have already guessed, A service area business delivers goods and services to its buyers. Service area business doesn’t own a physical location where a customer arrives and buys a product or a service.

    Service area businesses have to specify the areas they serve; this helps Google in displaying that Google my business profile if someone searches for a product or a service in a particular area. 

    Add the regions and cities that you provide your service in. Also, make sure that you add zip codes as well.

    As you can see in the image attached above, Google provides you an option between displaying an address on the profile or not displaying any address.

    This page will further redirect you to adding a service area or adding a physical address for your business, depending upon the option you choose. If you choose not to provide an address, you’ll be asked to identify the region you operate in.

    Contact details

    In contact details, you are required to provide your contact number and website address. You can skip both of these categories, but it is highly recommended that you add a contact number for your customers.

    88% of local consumer searches result in a store visit or a call within 24 hours. 

    Recalling all the times you might have called a business after collecting their contact number from Google will help you in realizing the importance of a contact number in your business profile. 

    Add a website address if you own a website. If not, no worries. A website address is not compulsory.

    Mailing address (optional)

    A mailing address is only required if you do not add an address to your business profile. This mailing address is hidden from the public and is for your use only. Google will send a postcard to you at this mailing address if you choose to verify your profile with the postcard option.

    Adding business hours

    You can change your business hours anytime. Keep your working hours up to date, because they help your customers in deciding the date and time, they want to give your shop or office a visit. If your business is closed on the days you have mentioned as open on your profile, make sure you update this piece of information.

    We have covered all the basics steps you need to get right for creating your Google my business profile.

    Here is an additional feature that you can use for your convenience.

    Add a free messaging option to your profile

    This messaging feature provided by Google is optional and fairly new. It allows people to send you free messages using your profile. It is a great feature for you if you want to connect with customers more personally. 

    You may also use this as an opportunity to inform people about a new product or service added to your portfolio.

    Your basic Google my business profile is complete. Here are some additional points you should follow.

    Add some photos and videos to your profile; great photos or videos may convince someone to visit your shop.

    Add a business description that not only describes your business but is also captivating for the visitors.

    Create a post in your profile whenever a promotion is coming up. You can also add a list of your products or services to your profile.

    Your Google my business profile is ready to be shown in search results, but our work here is not done. We also have to make sure that our profile is ranked well within the sea of business listings.

    Excluding the advertisements, almost 26 percent of all people searching for local business click on the first result in the list.

    Showing up in the 3-pack is our best chance at generating more leads. 3-pack refers to the top three searches Google generates as a result of a local search.

    Here are some tips to improve your chances of appearing in a 3-pack.

    • Your profile should contain all the necessary information.
    • If your business has a website, make sure it is optimized.
    • Increase your social media engagement and link it to your profile.
    • Encourage customers to leave reviews on your profile.
    • Keep your profile updated.

    Lastly, if you encounter any issues, you can always get a solution to your problems through Google my business help forum.
  • All You Need to Know About Crowdfunding

    Imagine this: You have always wanted to be an investor. So, you have a  business plan you’ve been putting on hold for years, and now you’re willing to plunge into the murky waters of the business world.  

    Yes, you have some capital, but it’s not enough to get your business off the ground. 

    Fortunately, today you don’t have to rely exclusively on your bank for financial help. The web is thriving with crowdfunding sites. 

    You can find financial assistance through crowdfunding sites whether you’re looking to fund your small business, raise funds for an NGO, or pursue a business-related hobby. 

    We will discuss all the pros and cons of crowdfunding in this blog post. We’ll also take a closer look at some of the crowdfunding sites available today, just in case you need to sign up with one.

    Crowdfunding definition

    Image source Slideshare

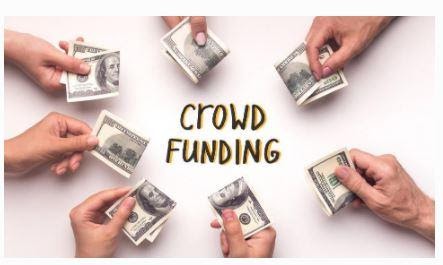
    Crowdfunding is a method of raising funds for a venture or a project from many people who contribute a small amount each, usually through the internet.   Artists, musicians, and filmmakers have effectively raised money and promoted brand awareness through crowdfunding.

    Example:

    Do you recall the popular TV show, Veronica Mars? It continued playing on the screens seven years down the line after it was canceled in 2014. It was only possible thanks to a kick-starter campaign in its amazing director started in 2014.  

    The show’s crowdfunding campaign was so effective that it raised a whopping 5.7 million. It’s so amazing that 91,585 people supported the campaign in just a single month.  

    The director received the funding plus the free publicity as an icing on the cake.  

    Crowdfunding is an excellent way for small businesses to raise funds in exchange for rewards, equity, debt, or free of charge.

    Business crowdfunding can offer you quick access to money. Still, it needs a robust promotional plan, increased transparency, and the willingness to give up a portion of your company.

     Here are some of the advantages you will enjoy if you consider raising funds for your dream venture or project or your business through crowdfunding.

    Advantages/ benefits of crowdfunding

    • It can be a cost-effective way to raise capital with no upfront costs.
    • Pitching projects or businesses on the internet can be a powerful form of marketing that attracts media attention.
    • When you share your idea, you can frequently receive feedback and expert advice on enhancing it.
    • Investors will track the progress you are making, which might help promote, which might help promote your company via their popular networks. 
    • Your investors can become your loyal customers as they can be personally attached to your brand. In addition, they have seen it grow from scratch through the funding process. 
    • It is a reliable funding option if you have grimly struggled to get conventional funding or bank loans. 
    • It is a fantastic way of gauging the public’s reaction to your ideas/ projects. 
    • If people are eager to invest, it’s a sure sign that your idea will do wonders in the market. 
    •  Nonetheless, crowdfunding has its fair share of drawbacks, just like anything else in the universe. Let’s look at some of them. 

    Cons/ Disadvantages of Crowdfunding 

    • When you’re on your selected platform, you’ll need to work hard to generate interest in your project before it launches. As a result, you’ll likely need significant resources in terms of time or money. 
    • Suppose you haven’t secured your business idea with something like a patent or copyright. In that case, someone else might come across it on a crowdfunding site. 
    • If the rewards or returns are incorrect, it may insinuate that you’ll give too much away to your investors.
    • If you do not meet your funding goal, any funds pledged, you’ll have to return all the finances to your investors and walk away empty-handed. 
    • Failed projects endanger your company’s reputation as well as the people who have pledged cash to you.

    How Crowdfunding Works For Entrepreneurs

    For some entrepreneurs, crowdfunding is the simplest method of raising funds for their small businesses. 

     If you have an incredible idea, that can be the next big thing. Still, you can’t get investors through the conventional way; pitch your idea on a crowdfunding platform.

    Your pitch should be clear, precise, and very interesting, as investors will gauge your idea based on the pitch you have prepared. 

    In exchange for funds, you can provide your investors with rewards or company securities.

    Crowdfunding also works for Individuals.

    Aside from charity fundraisers, investors, and startups, individuals can use crowdfunding platforms to raise funds for themselves.

    People use the internet to crowdfund their college tuition or even to pay off outstanding hospital bills. Others use the process to raise funds for college admissions, travel, and even debt repayment.

    Though crowdfunding is an excellent way of raising cash for your business, you should know which type of crowdfunding suits your startup.

    Below are the common types of business crowdfunding. 

    Real Estate Crowdfunding

    Real estate crowdfunding, also referred to as property crowdfunding, raises funds for real estate investments.  You contact a group of investors and ask them to contribute a small amount of cash to fund projects. 

    In a nutshell,  it is a way of raising funds that enables small real estate investors to participate in large-scale funding projects. 

    Types of Real Estate Crowdfunding

    Crowdfunding real estate is one of the best methods of building wealth quietly and strategically. 

    Real estate crowdfunding investments include

    • Common Equity
    • Preferred Equity
    • Debt Equity

    See each type of real estate crowdfunding side by side in the table below:

    Types of Crowdfunding

    Equity Crowdfunding 

     In Equity crowdfunding, traders raise funds for their small businesses by selling stocks and receiving capital in return. 

    Startups raise funds by selling securities like revenue shares, convertible notes, and debt shares.

    The equity crowdfunding platform Wefunder is a perfect example.

    From the corner cafe to the pharmaceutical company researching the benefits of growing plants, the site is open to every form of enterprise. 

    There are various options for the equity somebody will receive in return for their investments.

    Debt Crowdfunding 

    Debt crowdfunding, also known as “marketplace” funding, is when an entrepreneur borrows cash from other people rather than a bank. You borrow at a fixed annual percentage rate, and the loans are structured in the same way as conventional business loans.

    Reward crowdfunding

    With reward crowdfunding, also called non-equity crowdfunding, investors receive rewards such as t-shirts, coupons, mugs, concert tickets, etc., for their investments. 

    There’s no doubt you’ve heard of Kickstarter, where tens of millions of people have contributed to projects (maybe you’re one of them).

    Your campaign is open to anyone who finds it persuasive and wishes to donate. Irrespective of whether you seek funding to launch your video game, write your book, or whatever else you think will attract investors’ attention.

    Donation Crowdfunding

    As the name suggests, donation crowdfunding is for individuals who want to raise funds for a charitable cause or personal purposes.

    Investors contribute money for social good or a particular charity project without expecting anything in exchange. GoFundMe is one of the well-known donation-based crowdfunding websites. 

    Crowdfunding sites

    Many crowdfunding platforms are more suitable for product development. In contrast, others are ideal for artistic pursuits, and some do not look to gain from your investment.   

    Many crowdfunding websites will collect all funds as they come in, while others won’t take any until the target amount is reached.

    Here are the top crowdfunding sites you can use to finance your small business. 

    Patreon

    Patreon is a monthly subscription website where contributors and supporters make monthly donations rather than making a single bulk payment.

    You may contribute to projects for as little as $1 a month or as much as you like. It’s similar to a membership that’s been donated.

    The aim is to help a creative enterprise or artist on an ongoing basis, just as you would support your favorite band or singer.

    Crowdcube is a platform for equity crowdfunding that allows you to turn your family,  friends, fans, and customers into big-time investors.

    Upon receiving your pitch, they will assist you with developing realistic goals, a reasonable valuation, and an outstanding communication strategy to help you gain access to Crowdcube’s community of investors.

    Once you reach 20% of your goal, your pitch will go public. It takes  22 days for a rise to reach its target. Crowdcube’s legal team will step in when you get 75% funding to assist you in closing your round as quickly as possible.

    Price: There are no fees associated with listing your company on Crowdcube. You will be charged a success fee of 7% on the amount you successfully raise, as well as payment processing fees.

    Kickstarter

    Kickstarter connects musicians, filmmakers, and designers with the resources they need to make their brilliant ideas a reality. Since it gave out its baby cry in 2009, the company has successfully assisted 15 million people in pledging $3.7 billion to fund over 143,000 projects. You must meet your objectives within the time frame specified, or everyone’s money will be returned.

    Price: Creating a project on Kickstarter is free, but if it is successfully financed, Kickstarter deducts a 5% fee from the funds collected. There will also be processing fees ranging from 3% to 5%.

    Other crowdfunding sites/ platforms Include

    • ArtistShare.
    • Charitable.
    • Lending Club.
    • GoGetFunding.
    • Fundable.
    • Fundrazr.
    • Kiva.
    • MightyCause.
    • InKind.
    • Crowdfunder.
    • Give.
    • AngelList.
    • Ulule.
    • Funding Circle.
    • Seed&Spark.
    • Indiegogo.
    • GoFundMe.
    • Chuffed.

    Closing Thoughts 

    Now that your creative juices are flowing join a crowdfunding site and make your dream a reality. Do not spend another sleepless night wondering how to finance your startup. Crowdfunding is undoubtedly your savior in a time of need. 

  • Image optimization: A key tool for increasing traffic to websites

    Open a website, and images will start popping left, right and center, sometimes adding to the content they are presented with, other times taking away from it. 

    We see these images on websites play a crucial role in how websites are ranked and how much traffic they generate.
    Image optimization is more than just adding random stock images to your website to make your content more engaging for the readers.

    According to a study, “Images are the most popular way to search after keywords.”

    In 2018, 22.6 % of all internet searches were Google images; also, Image blogs emerge in 11 percent of Google results and generate 3 percent of all Google search clicks.

    So, suppose you want to make your business stand out and be noticed. 

    In that case, you have to leverage the power of images with your content.

    ” A picture is worth a thousand words” this statement indeed rings true in the case of online content. A good and relevant image can capture your audience’s attention and improve website ranking as well.

    Images should be optimized for both “WEB” and “SEO” to reap maximum benefits.

    First, I’ll start with SEO image optimization.

    SEO image optimization

    Image optimization is often ignored when it comes to SEO, even though Google emphasizes its importance for users and search engines. 

    Images are a great way to discover information on the internet visually. People search for images all the time, and an optimized image can lead many visitors to a website.

    SEO optimization of an image has several components; let’s start with the most important one 

    Alternative text

    Imagine an image of a delicious burger on a food blog; the moment you lay your eyes on it, your brain instantly recognizes it, but sadly when Google or other search engines crawl this site, they cannot view this delicious burger. 

    Instead, all they recognize is that it is an “IMAGE,” and the search engines don’t really know what to do with this “IMAGE,” this is where the “ALTERNATIVE TEXT” comes in. 

    Alternative text is a word or a term that is positioned as an attribute in an HTML file, and its purpose is to describe the nature or contents of an image.

    Alternative text should be descriptive and show precisely what the image is about. 

    This will help the image get indexed by search engines.

     Alternative text is helpful to the search engines; it also helps visually impaired people visit the website and use screen readers.

    Sometimes technical issues arise, and images cannot load, so the alternative text is shown in their place.

     A well-written description of the image in an alternative text can help visitors determine what the image is about if it is not loaded on the screen.

    Here are some tips for writing a good alternative text.

    • Be specific and concise

    A good way of doing that is assuming you are briefly describing an image to someone on a phone call, and this will give you a good idea of how to describe the image in a few words.

    • Do not add unnecessary explanations 

    Many people start writing their alternative text with “an image of “when visitors and search engines alike already know that they view an image’s alternative text.

    • Use relevant keywords

    Intelligently incorporating a few top keywords in the alternative text can help in the SEO optimization of the website. So, make sure these keywords are relevant to the image and do not add too many keywords, or else your website may be ranked down for keyword stuffing.

    • Avoid repeating text 

    Instead of adding the same words and phrases already used in the image caption or title, use different text to avoid repetition.

    Here is an example of a good alternative text for the image below:

    <imgsrc=”burger-1.jpg” alt=”beef burger with cheese ”/>

    Alternative text is undoubtedly the most important component in ranking an image, but a few other factors matter for better SEO image optimization. 

    Some of these factors are image captions, image titles, page titles, and descriptions.

    Image captions

    The second most important thing about an image is its caption; Image captions are the words shown directly beneath images. 

    Image captions do not directly impact SEO, but this text is directly visible on the website. 

    Good image captions can help grasp a visitor’s attention because Image captions are one of the most-read parts of a website. 

    Website Visitors read image captions to determine what kind of content is presented on a page. A catchy image caption can convince visitors to view content on the rest of the webpage.

    Ensure your image caption is relevant to the image and adds to the image in few descriptive words. Long and irrelevant image captions will surely bore the visitor, and they may leave your website.

    Let’s take an example of this image

    A good caption for this image can be 

    “Black headphones photographed with a yellow background.”

    Image Title

    A title is shown as a tooltip when we hover the mouse over an element. A title should be relevant, short, and explanatory to help search engines find these images when a search is done.

    You can skip adding keywords in the image title because keywords do not help in improving the ranking on search engines.

    An image’s title must complement the alternative text of that image. Using the exact words in alternative text and image title should be avoided; repetitive words and phrases can adversely impact website rankings.

    The page, title, and description

    According to Google, page title and description play a vital role in the image search algorithm. 

    Adding words and phrases relevant to the images in the page title and the content displayed on the page helps search engines improve image rankings.

    Relevant and explanatory information added to the content on the page helps search engines recognize better what the image is about and in what kind of search answers should it appear.

    We have covered all the necessary components of SEO image optimization. Let’s now move onto Web image optimization.

    WEB image optimization

    Web optimization is the process of using tools to improve and enhance the performance of a website. 

    Ensuring a good user experience can convince a visitor to explore the website further and sometimes even buy a product or service from that website if it’s selling one.

    According to Google, “53% of users will abandon a page if it takes more than 3 seconds to load“.

    Good quality images can have large file sizes, and often they take a ton of time to load, which in turn can slow down the webpage and result in loss of traffic for the website.

    Here are some of the benefits of image optimization for the web;

    • It improves the page loading speed and prevents visitors from leaving the site due to longer waiting times.
    • Fast loading websites generate a lot more traffic and thus are ranked better in search engine results.
    • Small image file sizes will make it easier and faster to create backups.
    • Small image files use less bandwidth.
    • Less space will be required on your server.

    Images make up on average 21% of a website’s total weight-Google; optimizing these images can help save a lot of space and time.

    There are a couple of ways to make images more optimized for the web. Let’s start with the most important one

    File size

    Large image files slow down the website and create a bad user experience for the visitors. 

    For image optimization, the size of an image should be reduced as much as possible without compromising the quality of the picture. So our primary goal should be finding the ideal combination of small file size and acceptable image quality.

    You can also experiment with different images and file formats to see which one works best for you.

    File format

    The most used file formats for images on websites are PNG and JPEG. 

    PNG provides better quality, but JPEG provides a much-compressed file size. 

    Both these formats are good for uploading images on websites. 

    You can choose a format that fits your image depending upon its size and quality.

    Here is a tip for you to take the maximum benefit of Image optimization

    Upload unique Images

    People usually upload stock images to their websites; these images are not a terrible way of starting, but unique and original photos can capture users’ attention.

    The people browsing our website may already have seen these stock photos on another website, and it makes our website unoriginal and a little less attractive in the sight of the user.

    So, make sure that you upload a unique image that is not accessible to other websites, providing content similar to yours.

    Bottom Line

    There is no specific formula to make a website successful. 

    Still, by learning and using many available tools, we can create a great user experience, and, in turn, our rankings on the search engine will improve.

    Image optimization is a free and useful tool that, if used wisely, can help you achieve your objectives.

    Let us know. What are your secret image optimization strategies?

  • Using 301, 302 redirect for optimized SEO

    In this high paced tech world, everyone is creating websites for their social and online presence. 

    The website can be used to represent a business or a personal blog. 

    Every website has a web address or domain name with which it is made accessible on the Internet. 

    People are always looking for fancy and easy domain names, as these are easy to remember. 

    If you are in luck, then you might end up acquiring a domain name that is fancy, easy, and represents your business or blog niche. 

    But most of the time, people are not that lucky, and they fail in acquiring their desired domain names. 

    What should one do when they don’t succeed in acquiring their desired domain name? 

    Fortunately, nowadays, we almost have a solution to every problem we face in the online world.

     This issue of domain name acquisition was sorted out by weblink redirection.  Yes, life was made easy. 

    In layman’s terms, redirection is simply a detour from one place to another, ensuring the end destination. 

    Let’s try to understand the web redirection process in detail. There are three different types of redirections which are:

    1. 301
    2. 302
    3. Meta Refresh

    301 redirect

    What is 301 redirect?

    301 redirect (also referred to as Technical SEO) is a solution people use to tell search engines that some pages or even their complete website have been routed to a new web address. 

    301 redirect can also be referred to as a set of instructions executed every time a user enters a specific web address. This set of instructions informs where to route the user when a certain web address is searched. 

    For example, you are looking to access a web store. You enter its last known web address. 

    As soon as you hit enter, you are automatically directed to a new web address. 

    This address is different from the one entered earlier, but this is a much better and refined website for that web store. 

    This process of rerouting a request from one location to another location is called a 301 redirect. 

    Why do I need it?

    Going through the internet searches, you find many reasons to have a 301 redirect for your website. But following are the most common reasons for using a 301 redirect.

    • Change in brand names
    • Add/ modify website content

    Change in brand names:

    Brands change, businesses grow, and people change. Everyone is looking for something new every day. 

    You can also see many of these changes on the Internet. Old websites replace new websites, but no one wants to lose traffic. 

    No one wants to let his hard-earned online followers go away. 301 redirects help people ensure that their customer base is successfully shifted from their old web address to the new ones. 

    It is also an SEO-friendly redirect ensuring your viewer to be at the right place. 

    Modify website content:

    Another common reason for using a 301 redirect is a modification in website design. One can always add a new page, change the content of a page, change a section or redesign the complete website.  

    How will I be benefited?

    Yes, I will be benefited.  I have to be honest; I can’t afford to lose my audience just because I have a new website.

    It is challenging to make your online presence and then maintain and grow it, ensuring more and more review. 

    But I also don’t want my existing viewer base to get bored and leave. So I have to work and improve my website constantly. 

    301 redirection is the answer to all my needs. It is the whole package of ensured redirection, seamless experience with optimized SEO, which helps maintain an online presence. 

    Any issues I might face?

    Everything has consequences. Some are worth the effort, and some are just to be avoided. 

    Using 301 redirections can affect indexing on a website because this redirection tells the search engine to look for the actual page or the URL somewhere else. 

    • First of all, the issues in indexing will lead to a decline in traffic. This is why a website is being updated or is under any maintenance activity. A permanent301 redirection is harmful. 
    • Secondly, smooth transitions between two domains (old and new) data migration is a must. Data migration should be completed before shifting from the old domain to the new domain. If not completed before, then users will be lost as there will no content to see.
    • Thirdly, it is very important to ensure that no multiple redirects make a chain effect and constant redirection between old and new web links. 

    Multiple redirects mean that your viewer is landing at an unknown address which is neither your new or old web address. In a well though 301 redirection scenario, your user will search for your old web address and be automatically redirected to your new web address. But unfortunately, a careless or wrong 301 redirection configuration might leave the customer switching between multiple pages. 

    • Last but not least, you have to understand that 301 redirections will add additional delays in the loading of your website. Some viewers may not like that. 

    Is 301 redirection easy to use?

    It depends on what language or method is being used to develop the website. 

    For me, WordPress works. So let me tell you how 301 redirects can be used in a website made on a WordPress template. 

    Simply use the plugin for 301 redirections.  Yes, it’s that simple and is quite famous among most website owners. 

    All you need to do is go into your web settings, and once you have installed and activated the 301 redirection plugin, move down to tools and select redirections. 

    The redirection section will require you to enter the “Source URL” any title. 

    If you want this to give it, select URL Only in the Match option and enter the task when matched with its HTTP code. 

    Enter your desired URL in “Target URL” and mention Group. Save the settings and BINGO! You have successfully enabled a 301 redirection on your website. 

    302 redirect

    Contrary to a 301 permanent redirection, some people also consider using a 302 temporary redirection.

     A 302 temporary redirection is used when a website is under temporary maintenance or upgrade. A 302 redirection doesn’t affect SEO ranking and is safer for Google Indexing. 

    Meta refresh

    If you want a redirect after a certain amount of time, then Meta Refresh is your redirection option. It is not commonly used, but you can always use it for specialized websites.

    How to choose from 301 or 302 redirect

    From a beginner’s perspective, it is always confusing what to choose from 301 or 302 redirects. 

    To make the right decision while choosing from 301 or 302 redirects, it is very important to know your needs. 

    Ask yourself why you need a redirection on your website? 

    What purpose will it fulfill? Will it be a permanent or a temporary redirect? Answering these questions will help in identifying your goal and achieving your target. 

    Failure in identifying the need and reason for redirection might end up ruining the SEO of the website. 

    Web developers usually prefer using a 302 redirect for the websites (either managing or creating for any client). 

    The reason is simple. It is easy to handle. It is temporary, and above all, there is no impact on Website SEO. 

    302 redirect also doesn’t affect Google indexing of the website. 

    So if you are planning on upgrading your website or add new functions/ features/ sections and pages, then yes, 302 redirection suits you the most.

     But if you are looking for a fancy new URL or domain and want your viewer to be auto-routed from an old link to a new link with a carefully used SEO scheme, then yes, you should go for 301 reroutings. 

    Bottom Line

    Redirection of users and search engines from one web address to another address is an effective way to develop, grow or enhance your website.

    But you should know the reason for which redirection is required on your website. Once the reason for redirection is defined, choose what type of redirection will help you minimize any unforeseen damage to your website. 

    Draft out all the things which could affect the page loading, SEO, and viewership on the website.

    Ensure that all the data has been shifted before the redirection configuration is done and do not make chain redirections. 

    Your website is your brand or business platform. You can’t risk your effort because of any careless mistake. 

    Always ensure a safe transition from one link to another, and know that it took you months to acquire a viewer. People must at least roam around your website if not buying anything. 

    Let me know if you have any questions?

  • Amazing WordPress Statistics 2022

    According to WordPress.org, the self-hosted WordPress infrastructure supports 35% of the websites on planet.

    You read it correctly.

    Ever since beginning in 2003, WordPress has undergone a paradigm shift. WordPress began as a blogging platform to suit the requirements of people who wanted to express their thoughts with the global community, but it has since grown into so considerably greater.

    WordPress has risen to prominence over the decades, owing to its open and free nature, and has amassed some impressive statistics for its own.

    And now, we’re going to be sharing the most excellent WordPress stats and information with you, which users can use to review content management systems in their decision making process.

    General WordPress Statistics

    1. WordPress was founded in 2003 by Matt Mullenweg & Mike Little as an extension of the b2/cafelog blogging platform. WordPress is already 18 years old.
    2. WordPress is licensed under the GNU General Public License, which specifies how and when individuals can modify the open-source technology. This licensing serves as the foundation for the WordPress Bill of Rights. It has four liberties:
      • WordPress must be capable of being used for many purposes.
      • To be able to modify it to meet your requirements.
      • Capability to bundle and distribute technologies to others.
      • To be willing to communicate your customized content management system and functionalities (for example, extensions, templates, customized account manager interfaces, and so on) with users.
    1. Including the most current 2018 financial statements: The WordPress Foundation earned $13,296 in revenue, with contributions accounting for $11,178 of the total. However, its expenditure ($42,938) greatly surpassed its revenue. Word Camp ticketing revenues and sponsorship deals produced $4,631,214 for WordPress Community Participation. Meanwhile, costs for the same period reached $4,486,658.
    2. There are already 420 revisions of WordPress released to date. 37 of them have considered significant upgrades. Major versions occur approximately 4 to 5 months and include new consumer functionalities as well as development capabilities. Incremental updates are made available when required. Typically, they will address problems, repair loopholes, or implement minor changes to the technology.
    1. WordPress.org continues to remain free to install and use now. Additional fees are involved with developing a WordPress project; however, the content management system is not on the list.
    2. WordPress is now available in 196 language groups.
    3. From its early beginnings, the WordPress Foundation has received around 346,000 lines of coding.

    WordPress Usage Statistics

    1. WordPress is now used by 62.4 percent of all websites developed using a CMS. WordPress websites account for 35.6 percent of all websites on the Internet, whether developed with or without a CMS.
    1. There seem to be 27,616,323 blog posts on the Web, and WordPress was used to generate 98 percent of such blogs.
    1. WordPress powers 48 percent of the top one million internet sites developed with a CMS. WordPress accounts for 74% of the leading 1 million websites developed with open technology that can be updated and shared, including WordPress.

    WordPress Community Statistics

    1. The information is not clearly available whether WordPress has any employees or not. However, it does have a big Community Management staff that evaluates everything professionally. This group is made up of the following individuals:
      – Matt Mullenweg is a co-founder.
      – 5 developers in charge.
      – Committers and fundamental development team.
      – Assistance forum operators.
      – Team in charge of paperwork
      – Reviewers of the theme
      – Reviewers of plugins


    1. With having popularity of wordpress and strong community demonstrated, it is probably reasonable to agree, according to Glassdoor Website, there are around 8,300 WordPress professionals available to hire.
    2. Knowing that there is constantly a request for fresh participants, the figure is certainly in the thousands. The Five for the Future project was founded in 2014 to motivate other firms to dedicate 5% of the existing workforce to WordPress development.
    3. Salary ranges appear to be between $15,000 and $140,000 per year, based on different sources.
    1. Workcamps are the locations they discover more concerning WordPress, meet like-minded people, and communicate with WordPress firms. Several of which were held in San Francisco in 2006.
    2. There seem to be approximately 1,660 clubs and 782,141 individuals that engage in these localized WordPress chapters.
    3. As of now, 1080 workcamps events have been accomplished in a single event in San Francisco.

    WordPress Plugin Statistics

    1.  There are presently 55,463 free extensions in the WordPress plugin library. Beyond WordPress, Website owners can discover free plugins, and therefore most plug-ins on creator websites are charged.
    2. Customization options plugins seem to be a hybrid of a plugin and a theme that allows WordPress users to automatically create web pages & add functionalities to them by utilizing a straightforward drag-and-drop styling editing.

    There are still more than a dozen page builder plugins accessible, but only approximately 5 or so have been well as well as exceptionally highly.

    1. Customers might require to manually put sophisticated functionalities and performance into their webpages if WordPress plugins were not available. That is why they are such a popular technique to increase the functionality of a website. Unfortunately, there seems to be no clear victor in the category of “highest configured,” as the WordPress source ceases monitoring deployments at 5 million.
    1. Over 7,200 WordPress plugins are available on the CodeCanyon world market. Unfortunately, because many programmers offer updates to their free plugins on respective web pages, this figure is likely to be underestimated.

    WooCommerce Usage Statistics

    1. WooCommerce, the leading eCommerce plugins and a WordPress set of tools, was developed in 2008 by 3 WordPress admirers.
    2. 3,876,748 eCommerce web pages use the WooCommerce plugin.
    1. The plugin has been downloaded approximately 83,000,000 times to date and supports roughly 28% of all e-commerce websites.
    2. WooCommerce is not a self-contained eCommerce infrastructure like its competitors; therefore, it enables it to be much more adaptable in its application. In the perspective of how many WordPress websites are WooCommerce equipped, which is 16.4 percent.

    WordPress Security Statistics

    1. More than 17,333 WordPress plugins had not been updated in the last 2 years. This implies that the vast majority of extensions remain unsubstantiated, potentially exposing WordPress consumers to danger.
    1. With several people still implementing obsolete WordPress infrastructure, businesses risk their businesses and customers. In 2019, obsolete CMS technologies were responsible for 49 percent of breached WordPress sites on the internet.
    2. As of this publication, just 34.9 percent of WordPress websites had been updated to the latest version. Most of the others are running obsolete WordPress editions which are no more protected and are insecure.
    3. Sucuri revealed their breached website danger analysis, which was informed on a survey of 60,299 recovered internet sites, over 98 million Site Check inspections, as well as an investigation of 170,827,313 targeted attacks.

    94 percent of all attacks were found on WordPress internet sites.  The additional justification why WordPress safety should be emphasized.

    1. Whereas the WordPress professional continues to work aggressively to make its ecosystem safe but there are almost 18,203 issues were discovered in recent days..

    Final Thoughts

    WordPress, the world’s most popular content management system, has made an undeniable impression mainly on the digital environment, and it’s not going to stop anytime soon. Every year, it grows, improves, and caters to much more web designers.

    With this large community engaging in the mission behind the whole open-source, extremely versatile, 100 percent adaptable, and economical technology.

    We can only aspire that the new releases of WordPress outperform our demands and address the severe security flaws impacting system consumers.

  • 60 E-commerce statistics 2022 – That you Must Consider for your Business

    Are you still searching for eCommerce statistics to encourage you to expand your internet presence? If you sell goods digitally it’s important to understand the importance of eCommerce so you can track your platform and implement any required adjustments.

    We’ve compiled a list of the latest impressive eCommerce figures you should be aware of in 2021.

    There seems to be an approximate 12 million – 24 million e-commerce platforms worldwide, with many being developed on a daily basis. So, do not be concerned if these figures lead you to believe that the industry is competitive. Only about 1 million of these pages sell higher than $1,000 per year, but there is plenty of space for expansion.

    The advancement of eCommerce is phenomenal, and it shows no indications of decelerating down in the near future, as shown by the statistics in this article. You would really like to incorporate what you’ve observed from the research and add it to your very own small start-up.

    So, without any more delay, let’s aim at those eCommerce statistics everyone should be aware of.

    General eCommerce Statistics

    1. The ability to buy throughout all hours of the day is the biggest reason consumers make purchases.
    2. Business owners reportedly suffered $756 billion since last year as a result of weak eCommerce personalized service.
    1. Six out of ten United States consumers utilize self-service platforms for their questions, such as portals (24%), smartphone applications (14%), voice monitoring system and Videoconferencing (13%), or online streaming talk (12 percent ).
    2. 61 percent of internet shoppers mostly in the United States previously initiated a buy based on web reviews.
    3. Whenever it comes to digital purchasing 59 percent of Consumers will go to Amazon directly, rendering the huge online retailer including some of the main rivals.
    1. It is predicted that just by 2040, the e-commerce market will reach 95 percent including all sales.
    2. At least one wired home computer is owned by 32% of internet users.
    3. Just 2.86 percent of people who visit eCommerce platform visits end in a purchase.
    1. In the United States, 2 in 5 customers (41 percent) obtain 1-2 shipments from Amazon for each week with the figure rising to 50 percent for ages ranging 18-25 and 57 percent for those aged 26-35.
    1. Amazon reported for 44 percent of all US eCommerce revenue in 2017.
    2. When they are unhappy with a commodity or business 55% of online customers tell their friends or relatives.
    3. 93.5 percent of worldwide online consumers have made an online order.
    4. Approximately half of participants claim they will buy anything from a platform’s virtual assistant including communicative advertising.

    Shopping Cart eCommerce Statistics

    1. Presenting free delivery raises sales for 46.5 percent of small and medium sized enterprises.
    2. Whenever you need profile creation mostly during the purchase process, 23% of consumers might leave their carts right away.
    1. Pages that take too long to load accelerate rejection by 75%.
    2. Garments have the maximum failure frequency (40%), accompanied by technology (18%) and household goods(16 percent ).
    3. Including an advanced shopping interface, e-commerce websites will improve user engagement by 35%.
    1. With an estimated failure average of approximately 70%, ecommerce websites could lose a value of $3 billion annually.
    2. Amongst all businesses, the overall cart rejection figure is 69.89 percent.
    3. Escape notifications also assisted in the recovery of 53% of misplaced customers.
    1. For holiday buying 76 percent of consumers choose to visit a traditional supermarket.
    2. WordPress multi-step types will increase transactions by 300 percent.
    3. Despite the fact that the eCommerce market is rising by 23% year after year, 46% of United states small firms do not possess a webpage.
    4. Credit card companies are the most commonly employed payment form worldwide, accounting for 53% of all expenditures, backed by digital payment services (43%), and card payments (38 percent ).
    1. A standardized or registered conversion rate optimization (CRO) approach is lacking in 68 percent of new enterprises.
    2. On Cyber Monday in 2017, smartphone sales surpassed $2 billion for the first time.
    1. 69 percent of B2B companies claim they want to avoid publishing catalogues over the next five years.
    2. Amazon is introducing an AI-powered, genuine product recommendation system open to vendors who are using the AWS platform.

    Mobile eCommerce Statistics

    1. 93 percent of Consumers have been using smartphones to check sale prices.
    2. Mobile phones account for 40% of all internet sales made mostly during the festive season.
    3. Mostly in the United States, 82 percent of Online shoppers have been using a smartphone to make a purchase.


    1. Smartphone app exchange rates are three times better than cellphone website gross margins.
    2. 73 percent of customers would move from a badly built mobile website to one which facilitates better shopping experiences.
    1. When in a physical shop, 65% of users start by looking up pricing differences on their mobile devices.
    2. Individuals who seem to have a terrible experience on your online platform are 62% less inclined to buy from them again sometime in the upcoming days.
    1. Bounce frequency on mobile websites increases by 32% as page loading cycles raise between 1 second to 3 seconds.
    2. In 2018, m-commerce revenues on Black Friday and Cyber Monday totaled over $2 billion, shattering existing world records last year.
    3. Applications compensate for about 90% of the time being spent on smartphones.
    4. Trying to make CTA icons (such as a Click-To-Call button) will increase interactions by 45 percent.

    Social Media eCommerce Statistics

    1. Before purchasing a gift for relatives and friends, 25 percent of the total US consumers check social networking sites.
    2. Online retailers with a social media following generate 32% higher revenue than someone without.
    3. Facebook claims for over 80 percent of all social networking site purchases.
    4. Pages with images get 53% additional Likes, 104% higher shares, and 84% increased click-through scores.
    1. On their Social media page, the average eCommerce website releases 4.55 updates per week.
    2. 74 percent of respondents of users make buying choices based on their socioeconomic connections.
    3. After seeing an Instagram advertisement message, 75% of Instagram users initiated an activity, which includes accessing the website.
    4. Consumers recommended by Instagram have an estimated purchase amount of $65.00, accompanied by Facebook ($55), Twitter ($46), and YouTube ($38).
    1. Posts on social networking containing 80 characters or less generate 66% greater participation.

    Email eCommerce Statistics

    1. The B2B eCommerce general market email promotions are effective since they have persuasive content at each point of the customer experience.
    2. 61 percent of customers choose products to reach them by email.
    1. Email Marketing strategy generates $44 for every $1 expended, resulting in a 4400 percent ROI.
    2. Email marketing accounts for 20% of transactions generating eCommerce revenue.
    3. Sixty percent of users claim they bought the product as a response to an email campaign post.
    1. Emails with unused shopping carts do have 45 percent quality score.
    2. Welcome emails are sent by 58% of the leading 1,000 United states internet-based merchants
    3. Revenue increases by 60 percent as compartmentalized advertisements are sent to email subscriber base.
    1. During the December Christmas eCommerce campaign, email marketing proved credited for 24 percent of vacation revenue.
    2. Non-profits in contributions each year as a result of malware filtering eliminating fundraiser project emails.
    1. Transactional emails receive 8 times the number of openings and clicks than just about any other form of email marketing and generate 6 times the revenue.

    Final Words

    So now you have everything! Eventually, the above rundown of eCommerce statistics will help you identify most ways. These stats might boost or seem to be doing great with your internet-based sales.

    It is essential to continue digging further into the multi-trillion global economy by studying the trends including who uses electronic commerce, including the patterns behind improved sales for leading e-commerce firms.

    The powerful expected rise in e-commerce implies that, even though your brick-and-mortar industry can overlook it anyway, you’ll be competing by 2021 if you don’t respond to changing shopping habits in an environment increasingly reliant on smartphones.

  • Eye opening SEO Statistics to Strategize Your SEO Plan in 2022

    Do you operate a business in the twenty-first century and don’t have a digital presence?

    If yes then you will fail for sure. This may appear heartless, but it is the truth.

    If you wish to get additional traffic, sales, advertise your business or offer some form of service. You must appear in digital search engine results, hopefully at the highest point.

    We’ve produced a summary of the 60 key SEO stats for expanding companies to assist you with this mission.

    We are here to catch things up for you to deliver a strategic SEO service. We mainly focus on key ranking factors, local SEO, backlinks, Video and mobile search SEO.

    TOP SEO Statistics

    1. The Average organic CTR is on the first Google mobile search result is approximately 26.9%.
    2. The CTR on average on first Google desktop search results is 32%.
    3. Google currently holds a share of 92.24% of the total worldwide search engine market.
    1. Only 53% of the websites are trackable and come from organic search engine results.
    2. More than 90.63% of contents and web pages get no traffic from Google Search results.
    3. Just 45.25% of searches on Google.com are generated from organic clicks.
    1. Approximately 50.33% of traffic on Google.com from All web browsers results in no or zero clicks.
    2. SEO utilizes more than 1000% traffic than organic Social Media.
    3. More than 69.7% of the search queries contain more than four words.
    1. On average SEO leads closes at a rate of 14.6%.
    2. More than 60% of the digital marketers believe inbound SEO and blog content generates the best quality leads.

    User’s Interest and Search Behaviour Statistics

    1. As per the latest stats, 54.61% and 2.76% of users prefer to use Mobile and tablet devices for their internet activities respectively. Whereas only 42.63% of user’s laptops or desktops.
    1. 65% of the people use their phone to accomplish their buying needs and other shopping-related queries.
    1. 79% of the users prefer mobile’s influence to take relevant measures before purchasing a product. Only 39% of people follow a detailed web search on a relevant product before purchasing.
    1. About 8% of the total search queries are phrased as questions.
    2. Google search results serve around 21% of the results that lead to more than one click methodology.
    3. A user, in general, takes 9 days to make a purchase decision in 2019 when compared with 2015.

    Backlink Statistics

    1. 75% of digital marketers prefer to use content marketing to generate links.
    2. On average a content marketing campaign generates 1 to 9 links as reported by top global digital marketers.
    3. the internet holds approximately 66.31% of web pages that have no backlinks.
    1. The average cost of publishing a guest post is $77.80.
    2. Most digital marketers prefer to use more than 63% of their link-building activities outsourced from third-party vendors.
    3. The average cost of buying a link is approximately $361.44.
    4. More than 73.6% of the domains work on reciprocal links. In simple words, they follow the give and take policy.
    5. Only 38% of the digital marketers work in link-building methods to improve the rankings and measure the primary  KPI effectiveness.

    Local SEO Statistics

    1. On average 33% of the mobile searches are related to the location.
    1. Approximately 76% of searches made on mobile devices are based on nearby locations or businesses.
    1. Around 28% of the google searches are made for purchasing goods from nearby stores.
    2. More than 45% of shoppers prefer to purchase products from online eCommerce sites rather than pick up stores. It is considered a flexible and reliable option to buy and receive items.
    1. Nearly 55% of the buyers use online videos to analyze the features of a product before actually shopping from a store.
    2. Last year 90% of the consumers used the internet to avail local business and services
    3. More than 54% of the smartphone users look for business hours and 53% of searches are made for directions to a local nearby store.
    1. From 2017 to 2019 the mobile queries like “Where to buy, Near me” reported a growth rate of 200%.
    1. Mobile searches for nearby stores generated a growth rate of 250% in 2017 to 2019
    2. There is an increase of 250% in the 2017 to 2019 on mobile searches for on sale and near me search queries.

    Mobile SEO Statistics

    1. More than 52.2% of the worldwide internet traffic on a website comes from mobile devices.
    2. More than 51% of smartphone users discovered unique or new products and companies while searching using smartphones.
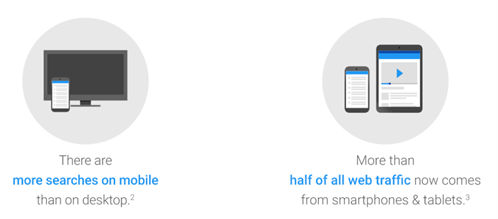
    3. The searches done using mobile and tablets are far more than desktop searches.
    1. On average a mobile phone search generates 27.7% of clicks whereas a desktop search generates 19.3%.

    Video SEO Statistics

    1. Video is the top form of media to be used for content marketing. It effectively overtakes blogs and infographics.
    2. The video ranking on YouTube improves with higher rates of comments, views, shares, and likes.
    1. YouTube ranks 68.2% of HD videos on its search results
    2. For better video rankings on YouTube, the video length must be of 14 to 15 minutes.

    SEO Industry Statistics

    1. In general, more than 74.71% of SEO services charges a monthly fee from their clients
    2. The most popular SEO pricing range is $501-$1,000 based on the project.
    3. The hourly SEO pricing falls between $100 to $150. It is the most commonly found rate across the globe.
    4. The monthly rental for SEO services is approximately $501-$1,000 demanding upon the project difficulty level.
    1.  More than 88.28% of the SEO firms charge less than $150 per hour.
    2. The global or international level SEO service providers charge 130.74% more than local monthly SEO providers.
    3. An average SEO service provider with 2+ years of experience charges 102.41% more for monthly packages, 39.4% more on hourly packages, and 275% more for off projects.

    Ranking Statistics

    1. Top ranking pages only generate 49% of the traffic.
    2. More than 90% of the webpage generates no organic search engine traffic from Google.
    1. Only 5.7% of the web pages manage to grab the top 10 search results within a year of its publication.
    2. More than 25.02% of the top-ranking web pages don’t have a meta description
    3. Meta description of webpages is shown only 37.22% of the time in a Google search.

    Keywords Statistics

    1. The web contains 70.87% of keywords that are capable of generating more than 1000 monthly searches. These keywords are one or two words.
    2. 13.53% of the available keywords get only 10 searches per month which contain one or two words in them.
    3. In general, 92.42% of the keywords generate less than 10 monthly searches.
    1. There are only 0.16% of keywords that are popular and generate more than 60.67% of the web searches globally.
    2. People use phrased questions for search queries that contain 8% of the keywords.

    Final Stats

    The digital world is evolving very fast with the help of data and experts and their powerful marketing campaigns. The modern-day trend of searching is shifted towards mobile and voice-based methods.

    Consumers are more specific in opting for services from local vendors and businesses. So Local SEO plays a big role in grabbing leads. The link-building techniques using Video media are considered to be more engaging to serve better strengthen values to your brand.

    You need to work precisely without missing a single SEO parameter to win the top position in the search.

  • 60 Amazing Advertising Statistics of 2022 That You Must Know

    For centuries, advertisement has proven to be an important influencing power in the global market. The global economy will begin a new phase of technological possibilities in the 3rd decade of the twenty-first century.

    Augmented reality and virtual reality will flourish as advertisement undergoes a renovation, by discarding obsolete methods set for the junkyard.

    We combed through plenty of other credible promotional analyses to get a clearer view of the existing market and recognize emerging developments in the marketplace.

    The information collected was being used to assemble this definitive compilation of advertisement statistics and information.

    Significant Advertising Statistics

    1. In 2020, global advertisement expenditure is foreseen to fall 9.1 percent.
    1. World advertising investment is expected to rise 7.6 percent in 2021.
    2. The United States is the world ‘s biggest advertising industry.
    1. The travel & tourism sectors recently experienced the greatest proportional drop in advertising investment, around 33.8 percent.
    2. According to advertising figures, there are seven distinct industries for advertising expenditure.
    3. Just three industries will increase their pre-pandemic rate of advertisement expenditure in 2021.

    Social Media Advertising Statistics

    1. According to social media advertising statistics, United States social media network advertising revenues are expected to hit $48.94 billion in 2021.
    1. LinkedIn generates 277 % higher lead generation than Twitter and Facebook combined.
    1. Snapchat’s income for the first, second, and third quarters of 2020 exceeds more than $1.5 billion.
    2. Advertisement accounts for 86 percent of Twitter’s total sales.
    1. By 2023, social networking advertising is expected to grow at the highest cagr of 29.12%, hitting $221.01 billion.
    2. In 2021, Facebook’s worldwide ad income is expected to hit $94.69 billion.
    3. According to Instagram advertisement projections, a whopping two million marketers use it each month.
    4. Nearly all of Snapchat’s profits come from advertisements.
    1. In 2020, Instagram’s advertisement turnover will be $13.86 billion.

    Digital Advertising Statistics

    1. According to mobile advertisement estimates, mobile advertising expenditure will surpass desktop advertisement investment in 2022.
    2. Digital advertising contributed to 64.31 percent of gross advertising revenues in 2020.
    3. According to figures, the digital advertising industry will be worth $982.82 billion by 2025.
    4. According to MAGNA, searching is still the most popular digital advertising platform.
    5. The perspective for Google advertising sales in the post-pandemic timeline is promising, with a 20.9 percent growth in 2021.
    6. For the very first time in 2019, Alphabet published YouTube advertisement sales.
    1. Global digital advertising spending is expected to raise between $332.8 billion in 2021 to $460.5 billion in 2024.
    2. Google Advertisements experienced its first decline in advertisement sales in 2020.
    1. In 2020, online streaming consumption continued to rise.
    2. Between 2021 to 2025, digital OOH advertising revenues are forecast to grow at a 7.9 percent CAGR.

    United States Advertising Statistics

    1. The advertisement decline in the US financial sector in 2020 was the first one in well over a decade.
    2. According to billboard advertisement figures, there will be 9,600 digital billboards in the United States in 2020.
    1. The Truth in Advertising Act of 2014 protects the consumer in the United States.
    2. In 2019, viewers spent 641,000 hours viewing Super Bowl commercials on YouTube around the globe.
    3. Amazon is the largest advertising company in the United States.
    4. A 30-second commercial during the Super Bowl cost $5.6 million.

    Exciting Advertising Statistics

    1. Fraudulent advertisement is widely regarded as the most harmful practice of the pharmaceutical sector.
    2. Prior to the disease outbreak, the nutrition, beverage, as well as restaurant industries in the United States spent over $14 billion on yearly advertisements.
    3. The Middle East and North Africa had the greatest decreases in advertisement investment in 2020.
    4. In a day, the ordinary individual is revealed to 6,000-10,000 advertisements.
    5. In 2021, electronic advertisement investment in the medical and pharmaceutical industries in the United States will top $11 billion.
    1. During the first six months of 2020, Pfizer’s digital advertisements jumped by 532 percent.
    2. Canada’s increase in electronic advertising revenues outperformed that of the United States.
    3. In 2020, advertising expenditures in Australia decreased by 8.3 percent.

    Traditional Advertising Statistics

    1. In the coming years, global radio advertisement investment will remain stable at about $30 billion.
    2. Global direct mail advertising sales climbed at a CAGR of 0.75 percent in 2020.
    3. Door hanger advertising figures suggest a marginally higher effectiveness rate than daily flyer advertisement, at about 5%.
    4. Since 2007, international newspaper advertisement investment has been reducing.
    5. Social networking is the best successful means of advertising according to 64% of marketing professionals.
    1. Direct mail marketing receives an immediate response from 79 percent of users.
    2. In 2020, worldwide investment in out-of-home ads is expected to decrease by about $10 billion.
    3. In 2020, the personalized t-shirt printing industry was estimated to be worth $3.64 billion.
    1. CTV advertising revenue in the United States is expected to reach $8.11 billion in 2020.
    1. In the United States, podcast advertisement profit is projected to top $1 billion by 2021.
    1. Transit advertisement is the most cost-effective method of marketing.
    2. About 42% of direct mail recipients read or check their mail.
    3. By 2021, the print media market value is expected to be $44.17 billion.
    4. Although with web sales the CAGR for newspaper advertising is expected to fall 6.11 percent between 2019 and 2024.
    1. The CAGR of worldwide Advertisements weakening in 2020 by 5%.
    2. More than 244.5 million United states buyers are approached by radio broadcasting than by any other information platform.
    3. At least 13% of all customer revenues are attributed to word-of-mouth advertising.
    4. In certain specific markets, word-of-mouth advertising can result in up to 200 times more revenues.
    5. In the United States, around 58% of the emails are from marketing agencies or advertisements.
    6. The overall performance rate for advertising flyers is 1% to 3%.
    7. Per-day automobile wrapping allows 30,000 to 70,000 encounters.

    Final Words

    The advertisement statistics described above demonstrate unequivocally that the market seems to be in a constant state of change. The whole technological revolution of opportunities has started opening as advertisers relate to technology advances.

    Sales promotion seems to be more challenging than it has ever been, and you must be relevant and competitive if you really want your company to pop prominently.

  • 60 Social Media Statistics 2022 That You Must Consider

    60 Social Media Statistics 2022 That You Must Consider

    We’re already into 2021, and since then, things haven’t changed significantly from 2020.

    To be the year of deadly virus saw significant changes in socio-economic development. Due to worldwide stay-at-home recommendations, internet traffic has reportedly gained considerable momentum.

    This was apparent in the digital interaction levels for numerous social networking sites. People were investing additional energy and exchanging richer stuff on the internet than it has ever been. It was most visible in last year’s social networking engagement statistics.

    This provides an exceptional difficulty for brands and enterprises. Because more individuals are spending a lot of time digitally, firms have altered their social media presence to optimize economic development in unpredictable circumstances.

    We produced a complete list of social media statistics based on the previous year’s traffic to help you make the best of the dynamic marketplace. These analytics may give you some insight to comprehend your targeted audience and market, allowing you to develop a profitable marketing strategy.

    All such statistics will assist you in evaluating critical issues, including:

    Which social media platform is better for promoting your company?

    What level of participation can businesses consider through various social media platforms?

    Which social networking site is top-rated among your primary audience?

    Social Media Usage Statistics

    1. Current networking media consumers have already surpassed 3.8 billion, roughly 9 percent (321 million fresh subscribers) gain over this time the year before.
    1. The standard user does have more than nine social media profiles and invests 2 hours and 16 minutes per day on social networking sites.
    2. In actual social media activity, 91% of people access social networks using smartphones.
    1. Video content is 40 times more likely to be considered on social media networks such as Facebook, Twitter, and Instagram.
    2. Instagram stories seem to be the popular media’s emerging sensation. Instagram stories grew from 150 million to 500 million everyday regular audiences in only 2 years.

    Instagram Statistics 2021

    1. Per month, almost 1.2 billion individuals use Instagram. India has the highest number of individuals on the listing (120 million).
    2. In 2020, Instagram subscribers invested approximately 30 minutes each day on the network.
    1. Every day, more than 200 million Instagram users view at least one corporate account.
    2. Instagram participation with businesses is ten times that of Facebook, 54 times that of Pinterest, and 84 times that of Twitter.
    3. After viewing a business or commodity via Stories, 58 percent of Instagram subscribers said they become highly fascinated with it.
    1. Apart from Facebook’s (80.4 percent ), Instagram has the highest social reference rate to e-commerce websites, contributing approximately 10.7 percent.
    2. Instagram is used for shopping by 11% of social networking site users in the United States.
    3. On Instagram, carousels receive higher genuine engagements than combining photos and videos.
    1. Each month, over 150 million consumers use Instagram Instant Direct messages to contact businesses.
    2. Per month, 130 million Instagram subscribers click on commercial postings, including 81% of people employing the facility to assist them in discovering new services and products.

    YouTube Statistics 2021

    1. YouTube is the highest widespread social media network in the United States, with 82 percent of Americans accessing it.
    2. With 2.2 billion users worldwide, Videos on youtube are streamed for over 1 billion hours every day.
    1. On average, the first-page video on Youtube is 14 minutes and 50 seconds in length.
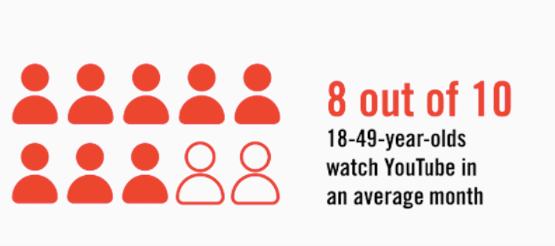
    2. Approximately 90% of users claim they discovered a new brand or product on YouTube.
    3. Sixty-eight percent of YouTube users have used a YouTube video to encourage them to make buying decisions.
    1. As per YouTube reports, the number of small and medium companies’ advertisements on YouTube has more than doubled in value in these 2 years.
    2. According to 79 percent of advertisers, YouTube is perhaps the most appropriate means for video advertisements.
    1. YouTube content creators are known for 92 percent of the traffic to funded YouTube posts.
    2. YouTube mobile advertisements are 84% more determined to retain viewers’ interest than Television commercials.

    Facebook Statistics 2021

    1. Facebook is now the social networking leader, with over 2.74 billion monthly active participants.
    1. It is the third most prominent platform, just behind Google and YouTube.
    2. The Facebook application is the second widely downloaded mobile app, with Facebook Messenger ranking seventh.
    3. With 320 million active customers, India seems to have the maximum Facebook consumers of any country on this planet.
    4. Users of Facebook devote 34 minutes a day to the website.
    1. A typical Facebook user likes 12 posts and comments 4 times a month.
    2. Every day, 500 million users use Facebook stories.
    3. There seem to be over 1.8 billion people who participate in tens of millions of Facebook communities.
    1. Despite making for just 3% of Facebook posts, videos receive the maximum levels of interaction.
    2. 90 million small enterprises use Facebook, taking advantage of features such as Pages, Groups, and Messaging.
    3. Facebook is the largest social the far more influential social media platform among US advertisers, with 87.1 percent using Facebook ads in 2020.
    1. Facebook contributes 80.4 percent of the social recommendation share of e-commerce pages in the United States.
    2. Facebook accounted for 18.3 percent of all purchases generated by different social media consumers in the United States, with Instagram contributing 11.1 percent.
    1. Facebook has a 2.14 billion advertisement audience, with the United States and Canada contributing for 47 percent of Facebook Advertising sales.
    2. The average Facebook consumer clicks on 12 advertisements per month.

    Twitter Statistics 2021

    1. After the platform’s launch in 2006, over 1.3 billion Twitter accounts have been registered. Twitter will have 353 million monthly active users in 2021.
    2. The android application is used by 80 percent of registered Twitter accounts.
    3. Every day, over 500 million tweets are sent.
    1. Twitter is used by 85 percent of small to medium-sized firms to offer customer support.
    2. In a tweet, 80 percent of users listed a company.
    1. When their tweet is responded to, 77 percent of Twitter consumers feel extra optimistic about a brand.
    2. Twitter advertisement awareness is increasing 27 percent, as per the company’s Q3 2020 survey.
    3. Twitter users devote 26% more attention to advertisements than all social media platforms.
    1. 40% of People on Twitter appear to be making a transaction to respond to an influencer’s post.
    2. Tweets of pictures and videos are 394% more likely to be retweeted.
    3. A typical Twitter user follows at least 5 different companies. Sixty percent of Twitter accounts expect a company or corporation to respond to their question within about an hour.

    Pinterest Statistics 2021

    1. Pinterest currently has over 459 million users worldwide, as per the company.
    1. Pinterest’s advertisement income is expected to exceed $1 billion by 2020.
    2. Pinterest users spend 14.2 minutes on average.
    1. Females account for 7 out of every 10 Pinterest subscribers.
    2. Across over 14 million posts posted every day, Pinterest has over 200 billion saved pins.
    1. Eight out of every 10 Pinterest members, or 82 percent of unique weekly visitors, reveal they have purchased items depending on the advertisers’ posts on the site.
    2. Pinterest is used by 28% of social media network advertisers to support their businesses.
    1. Pinterest accounts for 25% of all recommendation visits to prominent shopping websites.
    2. 50 percent of the millennial generation use Pinterest at least once a month, including 47 percent buying everything they see on the website.
    1. More than half of Pinners are directly searching for goods, which is even more than four times the number on other websites.

    Final Words

    Social networking is a constantly changing platform; something that emerges one year will be highly distinct the next. As a business, it is advantageous for the organization to generate a social networking approach unrelated to current trends.

    Consider these statistics to take full advantage of the social networking expenditure in 2021. Through social network analytics software, you can automate your content strategy and efficiently handle your social networking sites.

  • Dentist seo : Case study by analyzing 600 GMB profiles and Google Posts for Dentists

    We conducted a manual case study to find out what types of Google posts performed the best by manually analyzing over 600 posts from different of dentists and healthcare practitioners listed on Google My Business.

    In this study, we studied both GMB profiles and also reviewed analytics data from 600 dentists profiles we had access, at the time of writing this case study. According to Google My Business (GMB), and clicks and conversions inside Google Analytics (by using UTM codes), we found some posts perform better and some of them were not able to get even few clicks.

    What Are Google Posts?

    Google Posts are a way to market to patients & prospective patients (people searching for you on Google) through your Google My Business listing.

    Google Posts are offers, content, events, or highlights about your practice published – via Google My Business – which post directly to Google Search & Google Maps.

    According to Google, posting through Google My Business lets you publish your events, products, and services directly to Google Search and Maps.

    By creating posts, you can place timely, action-oriented content in front of patients & prospective patients when they find your business listing on Google or Google Maps.

    Why Would A Dentist Use Google My Business Posts?

    Because you’re reaching people when they are searching for you on Google & Google Maps!

    Google My Business Posts can help you engage patients – and more importantly, prospective patients – in a few different ways.

    GMB Posts will be effective for dentists because Posts allow you to maximize more real estate on Google’s search results page. You can showcase important updates about your practice, help promote local events (schools, sports, charity…etc.), and drive more clicks to your website, and landing pages.

    When people in your area (trusting you have good enough Local SEO) search for & find your Google My Business (GMB) listing, your Posts will be prominently displayed.

    4 more benefits all dentists (with verified, optimized GMB listings) will realize with effective Google My Business Posts:

    1. Captivating posts will make your Google My Business listing stand out from the competition.
    2. Posts appear more prominent on mobile devices…where MOST of your traffic comes from.
    3. People can share your Posts on their social media profiles, improving your engagement.
    4. People can click-to-call your office to make appointments or even online purchases. (whitening kits, fundraising, event promotion…etc.)

    Lets explore main type of Google posts

    Every post can include a short blurb (only the first 80 characters show up in search results), photos or even videos to help increase your practices relevance online.

    Live Event Posts

    Are you looking to promote an event that your practice is hosting or sponsoring? Look no further! Whether you are giving a presentation at a local school about the importance of oral health or volunteering at a food bank, showcase how your practice gives back to your local community!

    Special Offer Posts

    An offer post is a great way to expand your outreach for limited-time offers or promotional sales within your office. Special offers also include a call to action button that directs the patient to your website for more information. Every post can include the terms and conditions of the offer, a coupon code or link to an offers and promotions page within your website. This practice is offering a free Phillips Sonicare Electric Toothbrush for every new patient who joins the practice!

    Product  Posts

    Show off your newest or most popular products in the office! All you have to do is choose a compelling title and a photo or video that promotes the product. Tell your potential patients about the additional features and added benefits. Have you recently gotten an Itero scanner or started to offer in-office teeth whitening solutions? This example practice recently got new and improved online scheduling software. This lets potential patients know that scheduling with them is a breeze!

    Results from Case Study – What works best?

    When we measured the performance of the 4 different post types, the two types that performed the best were Product posts and offer posts. The worst-performing type was the update post type.

    Post Type # of Posts Clicks (GMB) Clicks (GA) Conversions
    Offer 299 3.06 0.51 0.08
    Product Posts 33 2.48 1.6 0.27
    Events 182 1.46 1.42 0.14
    Update 523 0.76 1.13 0.06


    We decided to calculate a click-through rate by dividing clicks by views. Doing this showed that update posts & event posts were still the worst performing post in terms of click-through rate.

    Post Type # of Posts Clicks (GMB) Views CTR
    Offer 299 3.06 512 0.6%
    Product Posts 33 2.48 570 0.4%
    Events 182 1.46 636 0.2%
    Update 523 0.76 277 0.3%

    When we looked at posts with titles compared to posts without titles, we found that posts with titles got almost twice the clicks and double the conversions.

    Title # of Posts Clicks (GMB) Clicks (GA) Conversions
    No 343 0.99 0.97 0.05
    Yes 697 1.90 0.84 0.10


    Photos that contained text in them got almost 4x the clicks compared to photos with no text.

    All Caps Title # of Posts Clicks (GMB)
    Yes 688 2.03
    No 306 0.59


    The orther GMB Post types that got the most activity were:

    1. Posts about specials or discounts.
    2. Posts containing a call-to-action. For example, including “contact us today” in the image or post title.
    3. Posts containing a sense of urgency. For example, highlighting that you offer same-day appointments for a dentist.

    The full list of categories is listed below. Posts could fall into multiple categories if they applied.

    Type # of Posts Clicks (GMB)
    Specials/Discounts 53 6.04
    Calls-to-Action 363 2.71
    Sense of Urgency 25 2.68
    We are Open 98 1.93
    Awards or USP 47 1.36
    Questions 234 1.23
    Products/Services 215 1.04
    Who we Are 106 1.03
    Seasonal 37 0.75
    Reviews 15 0.71


    Building signals of relevance and prominence around your practice is crucial for your online success.  However, different types of posts can bring different conversions to your practice. These results were admittedly at the bottom of the GMB Profile, but look how the content differs from the previous results brings value to your practice.