Do you operate a business in the twenty-first century and don’t have a digital presence?
If yes then you will fail for sure. This may appear heartless, but it is the truth.
If you wish to get additional traffic, sales, advertise your business or offer some form of service. You must appear in digital search engine results, hopefully at the highest point.
We’ve produced a summary of the 60 key SEO stats for expanding companies to assist you with this mission.
We are here to catch things up for you to deliver a strategic SEO service. We mainly focus on key ranking factors, local SEO, backlinks, Video and mobile search SEO.
TOP SEO Statistics
- The Average organic CTR is on the first Google mobile search result is approximately 26.9%.
- The CTR on average on first Google desktop search results is 32%.
- Google currently holds a share of 92.24% of the total worldwide search engine market.

- Only 53% of the websites are trackable and come from organic search engine results.
- More than 90.63% of contents and web pages get no traffic from Google Search results.
- Just 45.25% of searches on Google.com are generated from organic clicks.

- Approximately 50.33% of traffic on Google.com from All web browsers results in no or zero clicks.
- SEO utilizes more than 1000% traffic than organic Social Media.
- More than 69.7% of the search queries contain more than four words.

- On average SEO leads closes at a rate of 14.6%.
- More than 60% of the digital marketers believe inbound SEO and blog content generates the best quality leads.
User’s Interest and Search Behaviour Statistics
- As per the latest stats, 54.61% and 2.76% of users prefer to use Mobile and tablet devices for their internet activities respectively. Whereas only 42.63% of user’s laptops or desktops.

- 65% of the people use their phone to accomplish their buying needs and other shopping-related queries.

- 79% of the users prefer mobile’s influence to take relevant measures before purchasing a product. Only 39% of people follow a detailed web search on a relevant product before purchasing.

- About 8% of the total search queries are phrased as questions.
- Google search results serve around 21% of the results that lead to more than one click methodology.
- A user, in general, takes 9 days to make a purchase decision in 2019 when compared with 2015.
Backlink Statistics
- 75% of digital marketers prefer to use content marketing to generate links.
- On average a content marketing campaign generates 1 to 9 links as reported by top global digital marketers.
- the internet holds approximately 66.31% of web pages that have no backlinks.

- The average cost of publishing a guest post is $77.80.
- Most digital marketers prefer to use more than 63% of their link-building activities outsourced from third-party vendors.
- The average cost of buying a link is approximately $361.44.
- More than 73.6% of the domains work on reciprocal links. In simple words, they follow the give and take policy.
- Only 38% of the digital marketers work in link-building methods to improve the rankings and measure the primary KPI effectiveness.
Local SEO Statistics
- On average 33% of the mobile searches are related to the location.

- Approximately 76% of searches made on mobile devices are based on nearby locations or businesses.

- Around 28% of the google searches are made for purchasing goods from nearby stores.
- More than 45% of shoppers prefer to purchase products from online eCommerce sites rather than pick up stores. It is considered a flexible and reliable option to buy and receive items.

- Nearly 55% of the buyers use online videos to analyze the features of a product before actually shopping from a store.
- Last year 90% of the consumers used the internet to avail local business and services
- More than 54% of the smartphone users look for business hours and 53% of searches are made for directions to a local nearby store.

- From 2017 to 2019 the mobile queries like “Where to buy, Near me” reported a growth rate of 200%.

- Mobile searches for nearby stores generated a growth rate of 250% in 2017 to 2019
- There is an increase of 250% in the 2017 to 2019 on mobile searches for on sale and near me search queries.
Mobile SEO Statistics
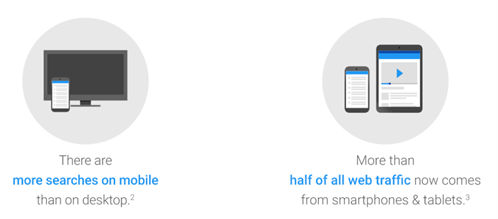
- More than 52.2% of the worldwide internet traffic on a website comes from mobile devices.
- More than 51% of smartphone users discovered unique or new products and companies while searching using smartphones.
- The searches done using mobile and tablets are far more than desktop searches.
- On average a mobile phone search generates 27.7% of clicks whereas a desktop search generates 19.3%.
Video SEO Statistics
- Video is the top form of media to be used for content marketing. It effectively overtakes blogs and infographics.
- The video ranking on YouTube improves with higher rates of comments, views, shares, and likes.

- YouTube ranks 68.2% of HD videos on its search results
- For better video rankings on YouTube, the video length must be of 14 to 15 minutes.
SEO Industry Statistics
- In general, more than 74.71% of SEO services charges a monthly fee from their clients
- The most popular SEO pricing range is $501-$1,000 based on the project.
- The hourly SEO pricing falls between $100 to $150. It is the most commonly found rate across the globe.
- The monthly rental for SEO services is approximately $501-$1,000 demanding upon the project difficulty level.

- More than 88.28% of the SEO firms charge less than $150 per hour.
- The global or international level SEO service providers charge 130.74% more than local monthly SEO providers.
- An average SEO service provider with 2+ years of experience charges 102.41% more for monthly packages, 39.4% more on hourly packages, and 275% more for off projects.
Ranking Statistics
- Top ranking pages only generate 49% of the traffic.
- More than 90% of the webpage generates no organic search engine traffic from Google.

- Only 5.7% of the web pages manage to grab the top 10 search results within a year of its publication.
- More than 25.02% of the top-ranking web pages don’t have a meta description
- Meta description of webpages is shown only 37.22% of the time in a Google search.
Keywords Statistics
- The web contains 70.87% of keywords that are capable of generating more than 1000 monthly searches. These keywords are one or two words.
- 13.53% of the available keywords get only 10 searches per month which contain one or two words in them.
- In general, 92.42% of the keywords generate less than 10 monthly searches.

- There are only 0.16% of keywords that are popular and generate more than 60.67% of the web searches globally.
- People use phrased questions for search queries that contain 8% of the keywords.
Final Stats
The digital world is evolving very fast with the help of data and experts and their powerful marketing campaigns. The modern-day trend of searching is shifted towards mobile and voice-based methods.
Consumers are more specific in opting for services from local vendors and businesses. So Local SEO plays a big role in grabbing leads. The link-building techniques using Video media are considered to be more engaging to serve better strengthen values to your brand.
You need to work precisely without missing a single SEO parameter to win the top position in the search.